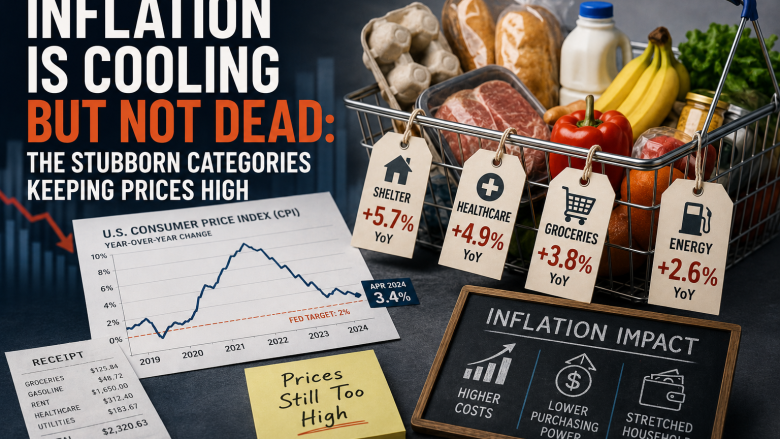
Headline inflation in the United States has fallen dramatically from its peak of 9.1% in June 2022 — a number that shocked a generation of Americans who had never experienced price instability of that magnitude. As of April 2026, the Consumer Price Index shows a year-over-year increase of 3.4%. Progress, certainly. But 3.4% remains well above the Federal Reserve’s 2% target, and more importantly, the composition of that remaining inflation tells a story about structural price pressures that will not yield easily to monetary policy tools.
Where Inflation Has Actually Fallen
To understand the remaining inflation problem, it helps to first acknowledge where genuine price relief has arrived. Goods inflation — the price of physical products like furniture, appliances, cars, and clothing — has largely normalized. Used car prices, which contributed enormously to the inflation surge of 2021-2022 as semiconductor shortages crippled new vehicle production, have declined 14.7% from their peak and are now rising at just 1.2% year-over-year. The Manheim Used Vehicle Value Index, a widely tracked indicator of wholesale used car prices, stood in May 2026 at levels last seen in 2020.
New car prices are flat to slightly down year-over-year. Furniture and bedding prices have declined 2.1% annually. Appliance prices are down 3.8%. The normalization of global supply chains, combined with a cooling in consumer goods demand as post-pandemic spending patterns shifted back toward services, has done exactly what the textbook predicted: relieved commodity-driven goods inflation.
The Shelter Inflation Problem
The stubborn core of remaining inflation is shelter. The BLS’s shelter index — which includes rent of primary residence and owners’ equivalent rent (OER) — rose 5.6% year-over-year in April 2026, accounting for the single largest contribution to the CPI’s elevation above the Fed’s target. Shelter makes up approximately 36% of the total CPI basket, so even modest shelter inflation has an outsized effect on the headline number.
The frustrating aspect of shelter inflation from a Fed perspective is that monetary policy influences it only with long and variable lags. The BLS measures rent inflation by surveying a sample of homes at six-month intervals, meaning that the CPI shelter data reflects rental contracts signed months or years in the past rather than current market rents. Real-time rental market data from Apartment List and Zillow shows new lease rents growing at approximately 2.3% annually — a much more benign figure — but this hasn’t yet fed into the official CPI measure because existing tenants with multi-year leases are still catching up to market rates.
The Federal Reserve Bank of San Francisco estimates that shelter inflation will not reach the Fed’s target until late 2026 or early 2027 even under optimistic assumptions about the housing market. This timing issue is one of the primary reasons the Fed has been reluctant to declare victory on inflation or pivot aggressively to rate cuts.
Services Inflation: The Labor Cost Problem
Beyond shelter, services inflation broadly remains elevated. The “supercore” inflation measure — services excluding shelter and food and energy — stood at 3.9% in April 2026. This category includes healthcare services, car insurance, restaurant meals, personal care, and professional services, and its persistence reflects the underlying reality that services are labor-intensive, and labor costs remain elevated.
Healthcare service costs have been particularly sticky. Hospital and physician services prices rose 5.2% year-over-year in April 2026, driven by nursing shortages, contract labor costs that surged during the pandemic and haven’t fully normalized, and the ongoing labor intensity of medical care. Auto insurance premiums rose 21.3% year-over-year in 2025 — a product of higher vehicle repair costs, increased accident frequency, and surging claims costs — and remain elevated despite some moderation in 2026.
Restaurant meal prices increased 4.1% year-over-year in April, reflecting both higher food input costs and the elevated minimum wages that have been implemented in California, New York, and other large states. The National Restaurant Association’s 2026 industry report found that labor costs now represent 36% of total restaurant revenue, up from 31% in 2019.
Food at Home: The Tariff Channel
Grocery inflation, which had meaningfully eased through 2024 and early 2025, has reaccelerated in 2026 to 3.2% year-over-year, with the USDA attributing the uptick primarily to two factors: tariff-related import cost increases and continued elevated processing and packaging costs driven by energy prices.
Coffee prices have surged 18.7% year-over-year following poor harvests in Brazil and Vietnam combined with higher shipping costs through the Red Sea. Orange juice prices are up 22% following consecutive years of citrus greening disease in Florida. These are largely supply-side phenomena, but they combine with the tariff pressures on imported foods — particularly from Mexico, which exports over $40 billion in fresh produce annually to the US — to keep grocery inflation above comfortable levels.
The Fed’s Dilemma
The Federal Open Market Committee faces a genuine policy dilemma. Inflation at 3.4% is well below crisis levels, but it remains meaningfully above target. Meanwhile, the labor market is cooling, consumer spending is slowing, and several forward-looking indicators suggest the economy may be losing momentum. Cutting rates too early risks re-igniting inflation; waiting too long risks pushing the economy into a recession that could have been avoided.
Fed Governor Christopher Waller, speaking at a Brookings Institution event in May 2026, summarized the committee’s posture: “We’re looking for sustained evidence that the remaining inflation is moving toward our target, not just a single favorable data point.” The Fed’s dot plot from the March 2026 meeting showed the median FOMC participant expecting just two 25-basis-point rate cuts in 2026, down from the three or four that markets had been pricing at the start of the year.
What Consumers Can Expect
The cumulative price level — the total increase in the cost of living since the pandemic began — will not reverse. Prices for most goods and services are approximately 21-23% higher today than they were in February 2020, even after inflation has come down from its peak. That cumulative increase is a permanent feature of the new price level, not a temporary blip.
For households, the practical implication is that budgets need to be recalibrated around a permanently higher cost of living, with particular attention to the categories where inflation remains stubborn: housing, healthcare, insurance, and food. The inflation era is not over — but its most acute phase almost certainly is. The remaining challenge is the grinding normalization of the final miles from 3.4% down to 2%.
Sources: Bureau of Labor Statistics, Federal Reserve, Federal Reserve Bank of San Francisco, Apartment List, Zillow, National Restaurant Association, USDA, Manheim Used Vehicle Value Index, Brookings Institution