For three decades following the end of the Cold War, the world economy operated on a simple organizing principle: produce where it’s cheapest, sell where demand is highest, and let comparative advantage optimize the global allocation of labor and capital. That model built enormous wealth, lifted hundreds of millions out of poverty, and created the deeply integrated supply chains that now form the backbone of modern manufacturing. And it is being dismantled — not suddenly, but methodically, driven by geopolitical competition, security concerns, and a growing political consensus in the US, Europe, and China that economic interdependence with rivals is a strategic liability.
The Data on Trade Fragmentation
The IMF’s October 2025 World Economic Outlook dedicated an entire chapter to what it called “geoeconomic fragmentation,” estimating that in a severe fragmentation scenario, global GDP could decline by up to 7% over the long run — an output loss equivalent to the combined annual GDP of France and Germany. Even in its baseline scenario, the IMF projects fragmentation costs of 2-3% of global GDP.
US goods trade data from the Census Bureau shows the rewiring already in motion. Chinese imports as a share of total US goods imports have fallen from 21.6% in 2017 to 13.8% as of Q1 2026. The gap has been filled primarily by Mexico, which is now the largest single source of US goods imports at 15.4%, Vietnam (rising from 2% to 5.1%), and India (up from 2.1% to 3.4%). This is the phenomenon economists call “friend-shoring” — redirecting supply chains toward geopolitically aligned partners — and it is reshaping trade flows in real time.
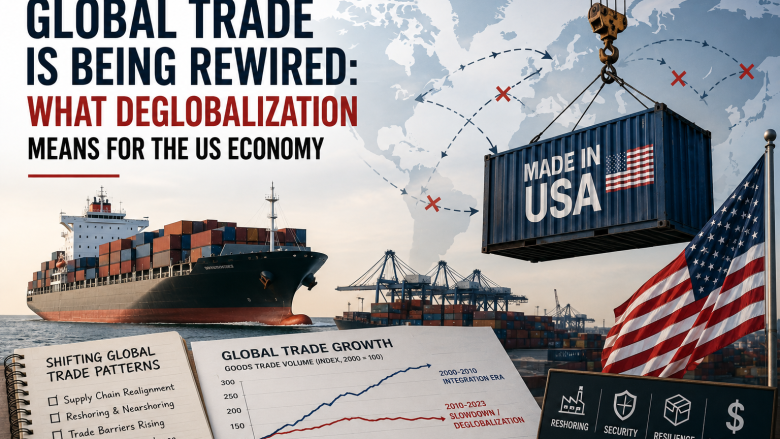
The World Trade Organization’s Global Trade Outlook published in April 2026 projected merchandise trade volume growth of just 2.7% for the year — roughly half the pace of global GDP growth and well below the 5-6% rates that characterized the pre-2018 era of globalization’s peak. The WTO flagged trade policy uncertainty as the primary driver of the deceleration, with tariff escalation between the US and China the central axis of concern.
Tariffs, Reshoring, and the Cost of Decoupling
The United States has maintained and in many cases elevated the tariff regime that began in 2018. Average US tariff rates on Chinese goods now exceed 30% for most categories, with additional surcharges on strategic industries including semiconductors, electric vehicles, solar panels, and steel. The Biden administration largely retained the Trump-era tariffs and added targeted industrial policy incentives through the CHIPS Act and Inflation Reduction Act.
The political appeal of reshoring American manufacturing is clear. The CHIPS Act has catalyzed over $400 billion in announced semiconductor manufacturing investments in the United States since 2022, with major facilities under construction in Arizona, Ohio, and Texas. The Inflation Reduction Act’s domestic content requirements have spurred investment in electric vehicle and battery manufacturing across the South and Midwest. These are real investments creating real jobs — but at real cost.
The Peterson Institute for International Economics estimated in a March 2026 analysis that producing semiconductors domestically costs approximately 30-50% more per unit than sourcing from Taiwan or South Korea, even after subsidies. The cost differential for solar panels manufactured domestically versus imported from Southeast Asia is even wider. These costs will ultimately be borne by consumers and downstream businesses, adding an inflationary baseline to the US economy that was absent during the peak globalization era.
The China Decoupling: Progress and Limits
The US-China economic relationship is fragmenting at the headline level even as deep dependencies persist underneath. US direct investment flows into China fell to a 25-year low in 2025, according to the Rhodium Group’s China Foreign Investment tracker. Major US multinationals including Apple, Nike, and Intel have publicly accelerated strategies to diversify manufacturing away from China.
But the decoupling is incomplete in ways that matter. China produces approximately 60% of the world’s rare earth minerals and 80% of refined rare earth products that are essential inputs for defense systems, electric vehicles, and advanced electronics. The US has no domestic rare earth processing capacity at scale, and building it will take 5-10 years even with sustained investment. China is also the dominant supplier of active pharmaceutical ingredients (APIs) used in generic drugs — approximately 80% of US generic drug API supply still originates from China or India.
The Commerce Department’s 2026 supply chain resilience report identified 50 “critical supply chain vulnerabilities” where the US remains significantly dependent on geopolitical rivals for essential inputs. Resolving these dependencies will require sustained investment measured in hundreds of billions of dollars and timelines measured in decades, not years.
The Mexico Dividend and Its Complications
As US-China trade has contracted, US-Mexico trade has boomed. Total bilateral trade between the US and Mexico reached $839 billion in 2025, surpassing Canada to make Mexico the United States’ largest trading partner for the first time on record. The USMCA has created a framework for deepened economic integration that is benefiting both countries.
But the Mexico dividend comes with complications. Chinese manufacturing companies have been rapidly establishing facilities in Mexico — a phenomenon called “transshipment” — to take advantage of USMCA preferences while avoiding US tariffs on Chinese goods. The US Trade Representative’s office has identified this as a priority enforcement concern, and new rules of origin requirements are being tightened to address the practice.
Mexico also faces capacity constraints. Its industrial labor force is growing but not at a pace commensurate with the manufacturing demand being redirected its way. Infrastructure bottlenecks — particularly in electricity generation, water, and port capacity — are limiting the speed at which Mexico can absorb additional manufacturing investment.
The Dollar’s Role in a Fragmenting System
One of the more consequential but underappreciated dimensions of geoeconomic fragmentation is its potential impact on the US dollar’s reserve currency status. The share of global central bank reserves held in US dollars has declined from 71% in 2001 to approximately 58% as of late 2025, according to IMF COFER data. While the dollar remains dominant and its position is unlikely to be suddenly displaced, the direction of travel is clear.
BRICS nations — Brazil, Russia, India, China, and South Africa, along with newer members — have been actively working to expand local currency trade settlement and reduce dollar dependency. Russia and China have significantly reduced their bilateral trade settled in dollars. The Fed’s own research acknowledges that a sustained erosion of dollar reserve status would reduce the US’s ability to run large external deficits at low cost — effectively tightening financial conditions for the American economy without any action by the Federal Reserve.
What This Means for the US Economy
The transition from a hyperglobalized to a more fragmented world economy will play out over decades, but its early effects are already visible: higher goods prices, a partial relocation of manufacturing to the US and allied nations, new industrial policy tools that both distort and redirect investment, and a geopolitical premium embedded in supply chain decisions that was entirely absent a decade ago.
For businesses, the message is clear: supply chain resilience now carries a cost that must be factored into pricing and capital allocation. For investors, industrial policy is creating winners — domestic manufacturers, infrastructure builders, and energy companies — and losers, primarily import-dependent retailers and multinationals with concentrated China exposure. For policymakers, the challenge is managing a complex transition that serves legitimate security objectives without imposing more economic costs than the security benefits justify.
Sources: IMF World Economic Outlook, US Census Bureau, World Trade Organization, Peterson Institute for International Economics, Rhodium Group, US Trade Representative, US Commerce Department, Federal Reserve, IMF COFER data